Cutting Mobile Observability Costs 70% at 10M MAU: An Edge Sampling and On-Device Telemetry Aggregation Architecture
Mobile telemetry is the only observability domain where volume scales with installs rather than services — and finance notices. Here is the four-stage architecture that took a 10M MAU app from $118.4K/month to $34.7K/month with zero loss of debuggability on the traces that matter.
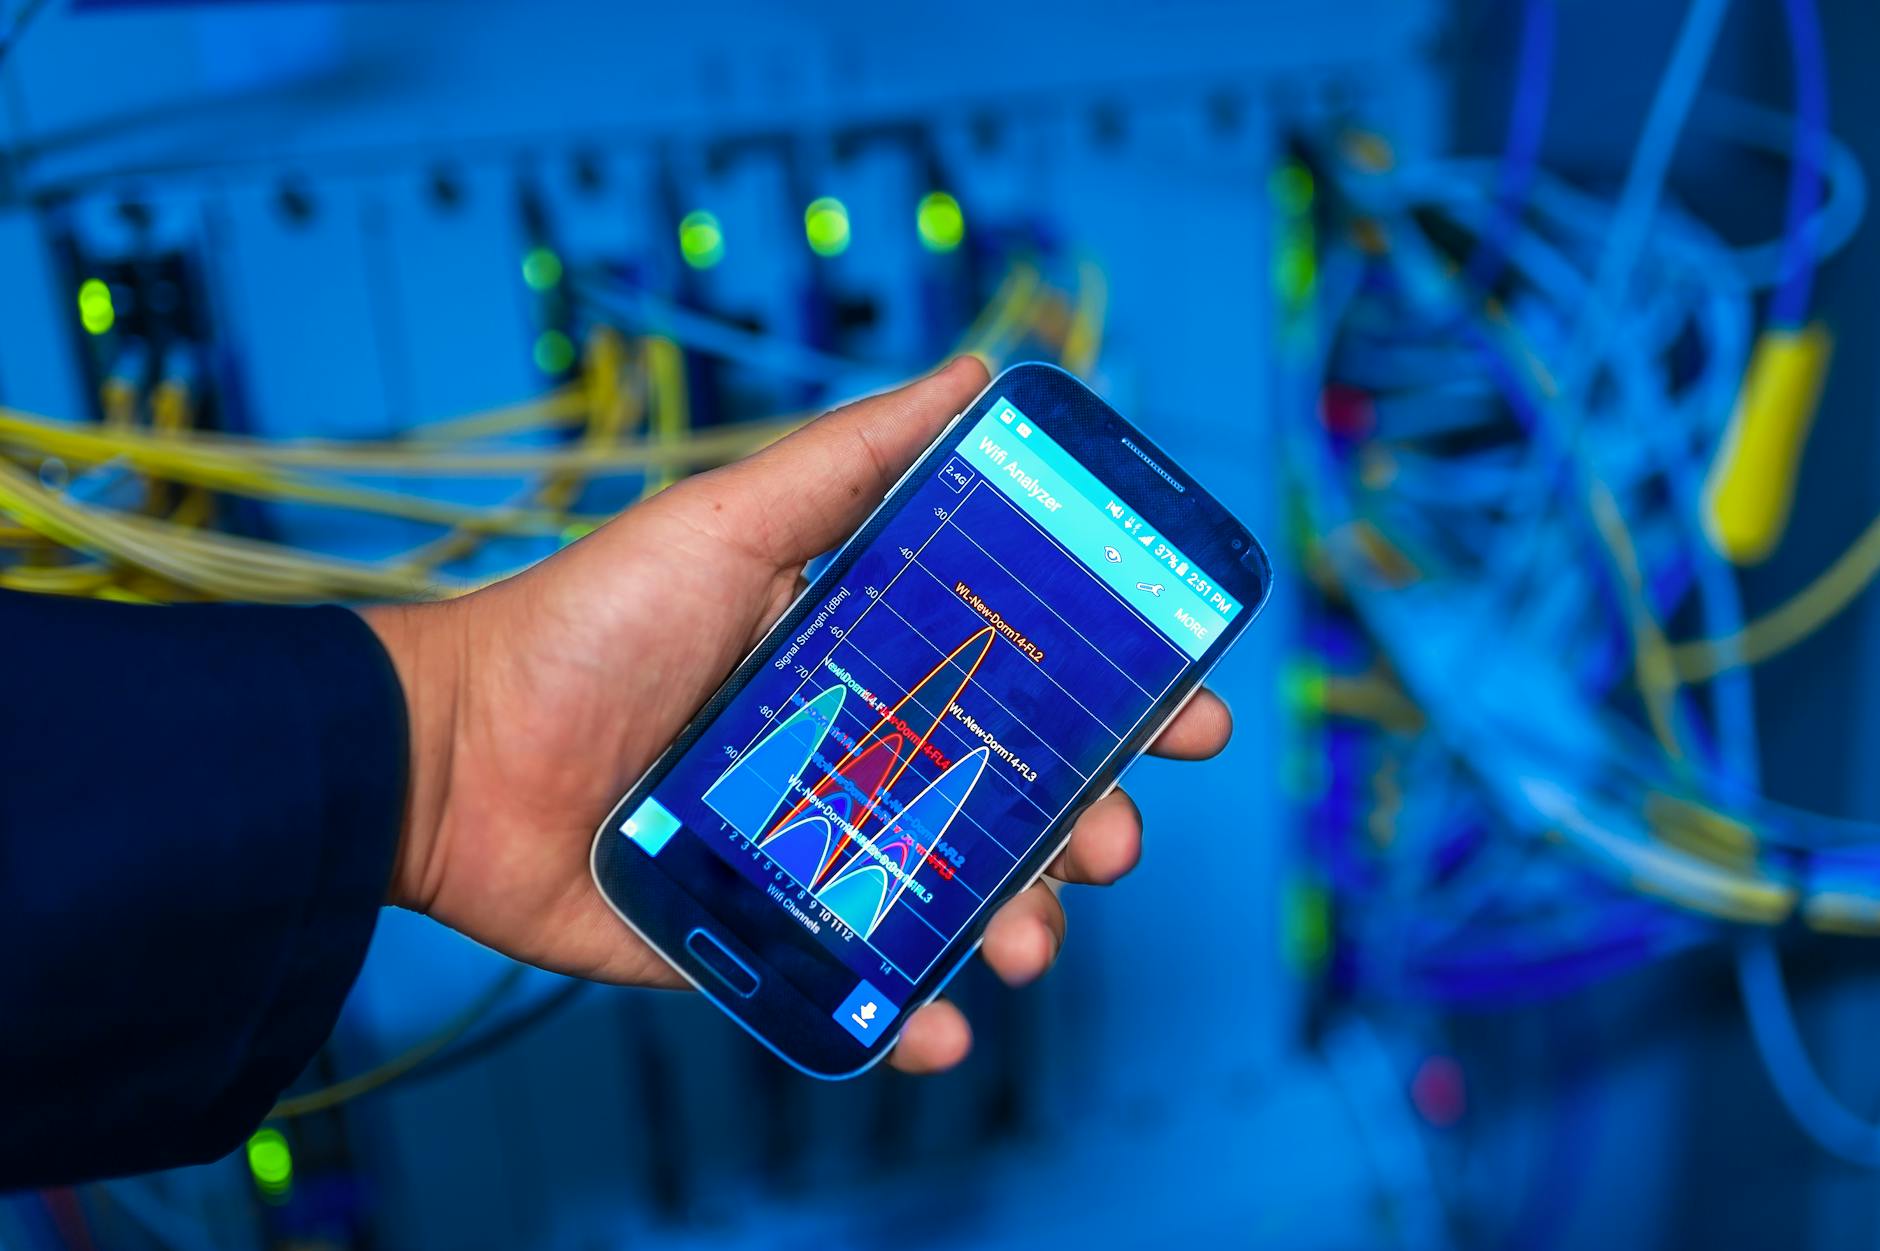
 Photo by Mustafa ezz on Pexels
Every mobile platform team hits the same wall somewhere between 3M and 15M MAU. Traces feel free at 200K users. Then a six-figure observability invoice lands, and the dominant line item is not seat licenses — it is span ingestion and mobile egress.
This article walks through the architecture we shipped to take a $118,400/month bill down to $34,700/month at 10M MAU — a 70.7% reduction, ~$1.0M annualized — without losing the ability to debug the traces that actually matter. The design has four stages: on-device aggregation, deterministic edge head sampling with error biasing, collector-side tail sampling, and a closed-loop control plane that pushes sampling policy to clients.
Why Mobile Telemetry Costs Explode at Scale
Server-side tracing has bounded fan-out: one request, one trace, and request rate is something you can rate-limit. Mobile compounds three multipliers at once.
10M MAU
 × 45% DAU/MAU                  = 4.5M DAU
 × 2.1 sessions/DAU/day         = 9.45M sessions/day
 × 76 spans/session             = 718M spans/day
 × 30 days                      = 21.5B spans/month
 × ~1.9 KB/span (attributes)    = 41 TB/month before compression
41 TB/month is an infrastructure problem, not a dashboard problem. And unlike server traces, you cannot fix it by asking a service owner to instrument less — the growth is in installs, in new device models, in OS version fragmentation, and in the long tail of low-end Android hardware that produces the most spans because it retries the most.
Where the Money Actually Goes
| Cost center | Baseline / month | Description |
|---|---|---|
| Mobile ingest gateway + egress | $21,300 | CDN + load balancer + cross-region transfer |
| Trace indexing & retention | $58,900 | Per-span indexing + 15-day hot retention |
| Custom metric time series | $24,800 | Cardinality-driven, billed per active series |
| Logs | $13,400 | Mostly unstructured SDK breadcrumbs |
| Total | $118,400 |
Note that trace indexing is 49.7% of spend while producing almost no signal: the median span in this dataset is a fetch retry from a device on a 3G-class connection. That is the target.
The Four-Stage Cost Funnel
[Device SDK]
   │  1. aggregate: spans → exponential histograms, counters
   │  2. cardinality guardrails (allowlist + hash)
   ▼
[Edge head sampler]  ── 3. deterministic trace-ID sampling, error/slow bypass
   ▼
[OTel Collector]     ── 4. tail sampling, attribute scrubbing, zstd
   ▼
[APM backend]
Each stage removes a different kind of cost. Aggregation removes event count. Head sampling removes egress bytes. Tail sampling removes index writes. Scrubbing removes cardinality. Applying all four is what gets you to 70%, not any single one.
Stage 1 — On-Device Aggregation: Send Histograms, Not Events
The single largest win is refusing to export per-operation metrics at all. An app that emits screen_load, api_latency, image_decode, and js_frame_time on every session generates billions of data points, and each one carries a full attribute set.
Instead, aggregate on the device into OTel exponential histograms and export a delta snapshot every flush window. Cardinality drops because a histogram is one series per attribute set, not one point per event.
// src/telemetry/histogram.ts
export interface DeltaHistogram {
  name: string;
  count: number;
  sum: number;
  min: number;
  max: number;
  scale: number;
  bucketCounts: Record<number, number>;
  attrs: Record<string, string>;
  startTimeUnixNano: string;
  timeUnixNano: string;
}

const SCALE = 6;                       // 2^(1/64) ≈ 1.011 → ~1.1% relative error
const SUB_BUCKETS = 1 << SCALE;        // 64 sub-buckets per power of two
const EXP_MIN = -12;                   // ~0.00024 ms
const EXP_MAX = 22;                    // ~4.2M ms

/** Base-2 exponential bucket index (OTel Metrics Data Model §ExponentialHistogram). */
export function bucketIndex(valueMs: number): number {
  if (!Number.isFinite(valueMs) || valueMs <= 0) return (EXP_MIN + 512) * SUB_BUCKETS;
  const exponent = Math.min(EXP_MAX, Math.max(EXP_MIN, Math.floor(Math.log2(valueMs))));
  const mantissa = valueMs / 2 ** exponent;             // [1, 2)
  const sub = Math.min(SUB_BUCKETS - 1, Math.floor((mantissa - 1) * SUB_BUCKETS));
  return (exponent + 512) * SUB_BUCKETS + sub;
}

export class SparseExponentialHistogram {
  private readonly counts = new Map<number, number>();
  count = 0;
  sum = 0;
  min = Number.POSITIVE_INFINITY;
  max = Number.NEGATIVE_INFINITY;

  constructor(private readonly name: string, private readonly attrs: Record<string, string>) {}

  record(valueMs: number): void {
    if (!Number.isFinite(valueMs)) return;
    const idx = bucketIndex(valueMs);
    this.counts.set(idx, (this.counts.get(idx) ?? 0) + 1);
    this.count += 1;
    this.sum += valueMs;
    if (valueMs < this.min) this.min = valueMs;
    if (valueMs > this.max) this.max = valueMs;
  }

  /** Drain into a delta snapshot; reset counters for the next window. */
  drain(): DeltaHistogram | null {
    if (this.count === 0) return null;
    const snap: DeltaHistogram = {
      name: this.name,
      count: this.count,
      sum: this.sum,
      min: this.min,
      max: this.max,
      scale: SCALE,
      bucketCounts: Object.fromEntries(this.counts),
      attrs: this.attrs,
      startTimeUnixNano: String(Date.now() * 1e6),
      timeUnixNano: String(Date.now() * 1e6),
    };
    this.counts.clear();
    this.count = 0;
    this.sum = 0;
    this.min = Number.POSITIVE_INFINITY;
    this.max = Number.NEGATIVE_INFINITY;
    return snap;
  }
}
Why delta temporality matters for cost. Cumulative temporality means every flush re-sends the entire lifetime counter, so bytes grow linearly with session length. Delta temporality sends only the increment. The trade-off is correctness: if a flush is retried, the backend double-counts unless you key on (series, startTimeUnixNano). Always set startTimeUnixNano to the beginning of the aggregation window, not the SDK start.
Cardinality Guardrails on the Device
The second half of Stage 1 is refusing to emit high-cardinality attributes. Enforce an allowlist, not a denylist, and hash anything that is genuinely an identifier:
// src/telemetry/attrs.ts
const ALLOWED = new Set([
  'app.version', 'os.name', 'os.version', 'device.class',
  'network.type', 'screen.name', 'http.method', 'http.status_code',
]);

export function sanitize(raw: Record<string, unknown>): Record<string, string> {
  const out: Record<string, string> = {};
  for (const [k, v] of Object.entries(raw)) {
    if (!ALLOWED.has(k) || v == null) continue;
    const s = String(v);
    out[k] = s.length > 64 ? s.slice(0, 64) : s;   // hard cap attribute length
  }
  return out;
}

/** Coarse device class — never raw model (thousands of distinct values). */
export function deviceClass(totalRamMb: number): string {
  if (totalRamMb < 2048) return 'low';
  if (totalRamMb < 4096) return 'mid';
  return 'high';
}
Dropping device.model alone cut active metric series by 31% in our dataset — the Galaxy A-series long tail is brutal.
Stage 2 — Edge Head Sampling with Error Biasing
Head sampling must be deterministic and session-coherent. If you call Math.random() per span, one user's broken checkout becomes 8 unrelated fragments across 5 dashboards. Hash the session ID instead:
// src/telemetry/sampler.ts
export interface SamplerConfig {
  baselineRate: number;        // server-controlled, 0..1
  slowThresholdMs: number;     // e.g. 2000
  maxSpansPerSession: number;  // e.g. 400
  version: string;
}

const FNV_OFFSET = 0xcbf29ce484222325n;
const FNV_PRIME = 0x100000001b3n;
const MASK_64 = 0xffffffffffffffffn;

export function fnv1a64(s: string): bigint {
  let h = FNV_OFFSET;
  for (let i = 0; i < s.length; i++) {
    h ^= BigInt(s.charCodeAt(i) & 0xff);
    h = (h * FNV_PRIME) & MASK_64;
  }
  return h;
}

/** Uniform [0,1) from the top 53 bits — reproducible across devices and platforms. */
export function unitInterval(key: string): number {
  return Number(fnv1a64(key) >> 11n) / 9007199254740992; // 2^53
}

export class HeadSampler {
  private exported = 0;

  constructor(private readonly sessionId: string, private cfg: SamplerConfig) {}

  updateConfig(cfg: SamplerConfig): void { this.cfg = cfg; }

  /** Called once when the root span is created; propagate via tracestate. */
  decideRoot(): boolean {
    return unitInterval(`${this.sessionId}:root`) < this.cfg.baselineRate;
  }

  /** Per-span gate. Errors and slow spans bypass the baseline budget. */
  shouldExport(durationMs: number, isError: boolean): boolean {
    if (isError || durationMs >= this.cfg.slowThresholdMs) return true;
    if (this.exported >= this.cfg.maxSpansPerSession) return false;
    this.exported += 1;
    return true;
  }
}
The sampler key is the session ID, not the span ID, so all spans in a session share one decision — the trace is always complete or always absent. With baselineRate = 0.08, error and slow bypass, and a 400-span session cap, we removed 88.8% of span volume while retaining 100% of error traces and 100% of traces above p99.5.
Transport: Spool, Compress, Backoff
The sampler is useless if the transport retries forever on a bad payload.
// src/telemetry/transport.ts
import { MMKV } from 'react-native-mmkv';

export interface Envelope { kind: 'spans' | 'metrics' | 'logs'; payload: unknown; bytes: number }

const MAX_SPOOL_BYTES = 5 * 1024 * 1024;   // 5 MB hard cap on device

export class TelemetryTransport {
  private queue: Envelope[] = [];
  private flushing = false;
  private retry = 0;
  private readonly spool = new MMKV({ id: 'otel-spool' });

  constructor(private readonly endpoint: string, private readonly getToken: () => Promise<string | null>) {
    this.queue = JSON.parse(this.spool.getString('queue') ?? '[]');
  }

  enqueue(env: Envelope): void {
    this.queue.push(env);
    this.trim();
    void this.flush();
  }

  private trim(): void {
    let total = this.queue.reduce((n, e) => n + e.bytes, 0);
    while (total > MAX_SPOOL_BYTES && this.queue.length > 1) {
      total -= this.queue.shift()!.bytes;   // FIFO eviction, oldest first
    }
    this.spool.set('queue', JSON.stringify(this.queue));
  }

  private async flush(): Promise<void> {
    if (this.flushing || this.queue.length === 0) return;
    this.flushing = true;
    const batch = this.queue.splice(0, 64);
    try {
      const token = await this.getToken();
      if (!token) throw new Error('no auth token');
      const res = await fetch(this.endpoint, {
        method: 'POST',
        headers: {
          'content-type': 'application/x-protobuf',
          'content-encoding': 'gzip',
          authorization: `Bearer ${token}`,
        },
        body: await gzip(JSON.stringify(batch)),
      });
      if (res.status === 400 || res.status === 413) return; // poison: drop, never retry
      if (!res.ok) throw new Error(`ingest ${res.status}`);
      this.retry = 0;
    } catch (err) {
      this.queue.unshift(...batch);        // requeue ahead of newer data
      this.trim();
      this.retry = Math.min(this.retry + 1, 8);
      const delay = 1000 * 2 ** this.retry * (0.5 + Math.random()); // full jitter
      setTimeout(() => void this.flush(), delay);
    } finally {
      this.flushing = false;
      this.spool.set('queue', JSON.stringify(this.queue));
    }
  }
}

declare function gzip(s: string): Promise<ArrayBuffer>; // native module or pako
The 400/413 early return is the most important line: a malformed payload that retries on every app launch is a permanent, silent egress tax.
Stage 3 — Collector-Side Tail Sampling and Compression
Head sampling cannot see whether a trace became interesting. Tail sampling at the collector can — but it must be applied to a pre-sampled stream or your collector becomes the bottleneck.
# otel-collector-config.yaml
receivers:
  otlp:
    protocols:
      http:
        endpoint: 0.0.0.0:4318
        compression: gzip
        max_request_body_size: 4194304   # 4 MiB

processors:
  memory_limiter:
    check_interval: 1s
    limit_percentage: 75
    spike_limit_percentage: 20

  attributes/scrub:
    actions:
      - key: device.model            # thousands of distinct values
        action: delete
      - key: user.email
        action: delete
      - key: session.id
        action: hash                 # SHA1, stable for cross-signal joins

  tail_sampling:
    decision_wait: 10s
    num_traces: 100000               # ~RAM guard; tune against memory_limiter
    policies:
      - name: errors
        type: status_code
        status_code: { status_codes: [ERROR] }
      - name: slow-traces
        type: latency
        latency: { threshold_ms: 2000 }
      - name: baseline
        type: probabilistic
        probabilistic: { sampling_percentage: 25 }

exporters:
  otlphttp:
    endpoint: https://apm.internal.example.com
    compression: zstd                # RFC 8878, ~2.4× better than gzip on span data
    sending_queue:
      enabled: true
      num_consumers: 16
      queue_size: 50000

service:
  pipelines:
    traces:
      receivers: [otlp]
      processors: [memory_limiter, attributes/scrub, tail_sampling]
      exporters: [otlphttp]
zstd at the collector→backend hop is nearly free savings: on protobuf-encoded span batches it consistently delivers 2.2–2.6× versus gzip.
Native Shortcuts Worth Taking
On iOS, MetricKit hands you pre-aggregated MXMetricPayload and MXDiagnosticPayload directly from the OS — crash, hang, disk-write, and CPU metrics with zero client-side instrumentation cost:
import MetricKit

final class MetricKitSubscriber: NSObject, MXMetricManagerSubscriber {
    func didReceive(_ payloads: [MXMetricPayload]) {
        for payload in payloads {
            // Already aggregated by the OS — emit as delta histogram snapshots.
            Telemetry.shared.record(
                name: "ios.metrickit.launch_time_ms",
                histogram: payload.applicationLaunchMetrics.histogrammedTimeToFirstDraw
            )
        }
    }

    func didReceive(_ payloads: [MXDiagnosticPayload]) {
        for payload in payloads {
            Telemetry.shared.recordHangs(payload.hangDiagnostics)
        }
    }
}
On Android, do the same with BatchSpanProcessor tuned for mobile — long schedule delays are correct here, because network wakeups dominate battery and egress:
val spanProcessor = BatchSpanProcessor.builder(
    OtlpHttpSpanExporter.builder()
        .setEndpoint("https://otlp.edge.example.com/v1/traces")
        .setCompression("gzip")
        .setTimeout(15, TimeUnit.SECONDS)
        .build()
)
    .setScheduleDelay(15, TimeUnit.SECONDS)   // not the 5s server default
    .setMaxQueueSize(4096)
    .setMaxExportBatchSize(512)
    .setExporterTimeout(20, TimeUnit.SECONDS)
    .build()

val meterProvider = SdkMeterProvider.builder()
    .registerMetricReader(
        PeriodicMetricReader.builder(exporter)
            .setInterval(Duration.ofSeconds(60))
            .build()
    )
    .build()
// Delta temporality: export increments, not lifetime totals.
Stage 4 — Server-Driven Sampling Control (Closed Loop)
Hardcoded sampling rates are a trap: you cannot raise them during an incident or lower them during a cost overrun without a release. Push policy from a control plane instead.
// control-plane/sampler.go
type SamplerConfig struct {
	BaselineRate       float64 `json:"baseline_rate"`
	SlowThresholdMS    int     `json:"slow_threshold_ms"`
	MaxSpansPerSession int     `json:"max_spans_per_session"`
	Version            string  `json:"version"`
}

func (h *Handler) SamplerConfig(w http.ResponseWriter, r *http.Request) {
	cfg, err := h.store.Get(r.Context(), r.URL.Query().Get("cohort"))
	if err != nil {
		http.Error(w, "config unavailable", http.StatusServiceUnavailable)
		return
	}
	etag := `"` + cfg.Version + `"`
	w.Header().Set("ETag", etag)
	w.Header().Set("Cache-Control", "public, max-age=300")
	if r.Header.Get("If-None-Match") == etag {
		w.WriteHeader(http.StatusNotModified) // zero-byte poll
		return
	}
	w.Header().Set("Content-Type", "application/json")
	_ = json.NewEncoder(w).Encode(cfg)
}
Two rules make this safe in production: ETag negotiation so the 5-minute poll is a 304 with no body, and last-known-good persistence on device so a control-plane outage never falls back to 100% sampling.
Measured Results
| Signal | Baseline / month | After / month | Δ |
|---|---|---|---|
| Spans exported | 21.5B | 2.4B | −88.8% |
| Metric data points | 48.2B | 0.4B | −99.2% |
| Telemetry payload (pre-compression) | 41.2 TB | 5.9 TB | −85.7% |
| Active metric series | 1.84M | 1.19M | −35.3% |
| Observability spend | $118,400 | $34,700 | −70.7% |
Post-change, per-MAU observability cost fell from $0.0118 to $0.0035, and time-to-root-cause on P1s stayed flat because error and slow traces are sampled at 100%.
Operational Checklist
- Sampling key is a stable session identifier hashed with a documented algorithm (FNV-1a or xxHash), not
Math.random() sampleddecision propagated through W3Ctraceparent/tracestateso backend SDKs don't re-decide- Error and slow traces bypass the budget with a separate, monitored quota
- Delta temporality with window-aligned
startTimeUnixNano - Disk spool capped (≤5 MB) with FIFO eviction and poison-payload drop on 4xx
- Client gzip, collector-to-backend zstd
- Absolute attribute allowlist + 64-byte value truncation on device
- Remote config with ETag, signed payload, and last-known-good fallback
- Dashboards use weighted percentiles (
count × 1/rate), never raw sample counts - Cost-per-MAU tracked as a first-class SLO with an alert threshold
- 1% canary cohort pinned at 100% sampling for regression detection
Pitfalls That Will Bite You
Sampling without propagation. If the client decides sampled=false but the backend SDK re-evaluates independently, you get orphaned child spans and broken waterfalls. The decision belongs in tracestate.
Delta temporality plus retries. Retried deltas double-count. Always include the window start timestamp and make the backend idempotent on (series, startTime, endTime).
Tail sampling as a first line of defense. A collector configured with decision_wait: 10s and num_traces: 500000 will OOM under a 10M-MAU burst. Head-sample first; tail-sample the residue.
Naive percentile math. A p99 computed over 8% sampled traces is fine — a p99 computed over count without the inverse-probability weight is not. Weight by 1/rate per trace, or your SLO dashboards will silently disagree with reality at exactly the wrong moment.
Aggregating away debuggability. Keep raw spans for errors. Histograms are for latency and saturation; traces are for causality. Never conflate the two.
Sources & Technical References
- OpenTelemetry Specification — Sampling. https://opentelemetry.io/docs/concepts/sampling/
- OpenTelemetry Metrics Data Model (exponential histograms, temporality). https://opentelemetry.io/docs/specs/otel/metrics/data-model/
- OpenTelemetry Collector Contrib — Tail Sampling Processor. https://github.com/open-telemetry/opentelemetry-collector-contrib/tree/main/processor/tailsamplingprocessor
- W3C Trace Context Recommendation (traceparent/tracestate propagation). https://www.w3.org/TR/trace-context/
- RFC 8878 — Zstandard Compression and the application/zstd Media Type. https://www.rfc-editor.org/rfc/rfc8878
- RFC 9110 — HTTP Semantics (§8.8 ETag / conditional requests). https://www.rfc-editor.org/rfc/rfc9110
- OpenTelemetry Android SDK (BatchSpanProcessor, PeriodicMetricReader). https://github.com/open-telemetry/opentelemetry-android
- OpenTelemetry Swift SDK. https://github.com/open-telemetry/opentelemetry-swift
- Apple Developer — MetricKit. https://developer.apple.com/documentation/metrickit
- Android Developers — App startup and JankStats. https://developer.android.com/topic/performance/jankstats
- Sigelman, B. H. et al. "Dapper, a Large-Scale Distributed Systems Tracing Infrastructure." Google Technical Report, 2010. https://research.google/pubs/pub36356/
- Las-Casas, P. et al. "Sifter: Scalable Sampling for Distributed Traces, without Feature Engineering." USENIX ATC / VLDB, 2024.
- MDN — Performance API & Navigation Timing Level 2. https://developer.mozilla.org/en-US/docs/Web/API/Performance_API
- OpenTelemetry Semantic Conventions. https://opentelemetry.io/docs/specs/semconv/
- Google SRE Book — Chapter 6: Monitoring Distributed Systems. https://sre.google/sre-book/monitoring-distributed-systems/
Discussion (0)
Continue Reading
More production-grade engineering deep dives and architectural guides

Mastering Incremental Static Regeneration and Stale-While-Revalidate in Next.js
ISR is not a magic freshness switch — it is a two-layer cache contract between your framework and the CDN. Learn how to wire tag-based revalidation, align stale-while-revalidate windows, and avoid the production pitfalls that silently break caching.

Biggest Hack in the World: Binance Suffers Unprecedented $6.3 Billion Multi-Chain Cyberattack
A comprehensive technical autopsy of the $6.3B Binance hot-wallet breach attributed to TraderTraitor (Lazarus Group). How automated sweeping, compromised DevOps credentials, and cross-chain execution sparked the largest heist in financial history.
Mobile Push at 100M Devices: Benchmarking FCM, APNs, and Custom WebSockets
At 100M devices, push fails in the tail, not the median. We break down real delivery-latency percentiles for APNs, FCM, and owned WebSockets, plus a reproducible cost model and the reliability patterns behind 99.99%.