Trail Blazers 136, Lakers 129: Inside Damian Lillard's Clutch Dagger and the NBA's Real-Time Tracking Architecture
Analyzing the Trail Blazers' electrifying 136-129 victory over the Lakers at Crypto.com Arena: Damian Lillard's iconic dagger, Luka Dončić's 41-point effort, and how Second Spectrum optical tracking and spatial telemetry compute shot probabilities in sub-50ms.

Trail Blazers 136, Lakers 129: Lillard's Return Dagger & The Real-Time Sports Telemetry Stack
On Tuesday night, October 27, 2026, the basketball world was treated to an early-season classic at Crypto.com Arena in Los Angeles. In a battle between two unbeaten squads, the Portland Trail Blazers edged the Los Angeles Lakers 136–129, handing Los Angeles their first loss while pushing Portland's record to an unblemished 3–0 (#RipCity).
While Luka Dončić poured in a game-high 41 points and 9 assists for the Lakers and Austin Reaves chipped in 26, the night belonged to Damian Lillard. Wearing the Portland jersey once more, Lillard capped a 21-point outing with trademark poise: stepping back behind a screen and drilling a cold-blooded, 29-foot dagger with 42.8 seconds remaining to establish an insurmountable six-point lead.
Beyond the box score, modern sports like the NBA are increasingly powered by distributed computing systems, spatial computer vision, and low-latency analytics pipelines that transform every cut, pass, and defensive rotation into actionable engineering data.
Game Recap: Key Numbers & Turning Points
FINAL SCORE:
Portland Trail Blazers   136  (3-0)
Los Angeles Lakers 129 (3-1)| Key Performer | Team | Statline | Impact Rating |
|---|---|---|---|
| Damian Lillard | Trail Blazers | 21 PTS, 6 AST, 4 3PM (Game-clinching 3PT at 0:42) | +14 Net Rating |
| Ja Morant | Trail Blazers | 23 PTS, 8 AST, 4 REB | Relentless downhill rim pressure |
| Deni Avdija | Trail Blazers | 23 PTS, 7 REB, 3 STL | Two-way wing defense on Dončić |
| Jrue Holiday | Trail Blazers | 22 PTS, 5 AST | Perimeter containment |
| Luka Dončić | Lakers | 41 PTS, 9 AST, 8 REB | Elite offensive creation |
| Austin Reaves | Lakers | 26 PTS, 5 REB, 4 AST | Secondary scoring spark |
With officiating crew chief Scott Foster overseeing a whistle-heavy third quarter that drew fervent online discourse, the Blazers relied on their four-guard scoring rotation and switchable wing containment to weather a ferocious 18-6 fourth-quarter run led by Dončić.
The Engineering Architecture: How Modern Arenas Track Every Millisecond
Have you ever wondered how broadcast graphics display shot probabilities, defensive contest distances, and player sprint velocities in real-time?
1. Optical Tracking with Second Spectrum & Hawk-Eye
Every NBA arena is equipped with an array of multi-camera synchronous rigs (typically 12 to 14 4K cameras running at 60fps to 120fps) calibrated to millimeter precision:
- Pose Estimation: Deep learning models identify 29 skeletal landmarks on all 10 players and the ball 60 times per second.
- Ball Trajectory Physics: Optical sensors track the seam rotation and 3D parabolic trajectory of the basketball, computing expected shot conversion rates while the ball is still in mid-air.
flowchart LR
    A[12x 4K Ultra-Sync Arena Cameras] --> B[Edge Computer Vision GPU Nodes]
    B --> C[3D Skeletal Mesh & Ball Physics Solver]
    C --> D[Sub-50ms Kafka Stream]
    D --> E[Broadcast AR Graphics & Team Bench Tablets]
2. Low-Latency Kafka Stream & Spatial Calculations
Here is a conceptual look at how spatial tracking events are filtered and analyzed at the edge:
interface SpatialCoordinate {
  x: number; // Court width: 0 to 50 ft
  y: number; // Court length: 0 to 94 ft
  z: number; // Rim height elevation: 0 to 15 ft
}

interface PlayerTelemetry {
  playerId: string;
  jerseyNumber: number;
  position: SpatialCoordinate;
  velocityFps: number;
}

export function calculateContestSeparation(
  shooter: PlayerTelemetry,
  defenders: PlayerTelemetry[]
): { closestDefender: PlayerTelemetry; separationFeet: number; isContested: boolean } {
  let minDistance = Infinity;
  let primaryDefender = defenders[0];

  for (const defender of defenders) {
    const dx = shooter.position.x - defender.position.x;
    const dy = shooter.position.y - defender.position.y;
    const distance = Math.hypot(dx, dy);

    if (distance < minDistance) {
      minDistance = distance;
      primaryDefender = defender;
    }
  }

  // NBA defines closely contested shots as under 3.5 feet separation
  return {
    closestDefender: primaryDefender,
    separationFeet: Math.round(minDistance * 10) / 10,
    isContested: minDistance < 3.5,
  };
}
Takeaways for Developers & Analysts
- High-Frequency Sensor Ingestion: Real-time sports platforms process roughly 2.5 million coordinate points per 48-minute game. Building systems that handle this throughput requires zero-allocation memory buffers and WebSockets/WebTransport.
- Deterministic Time-Syncing: Aligning broadcast video feeds with mathematical analytics requires synchronized SMPTE timecodes across every server node.
- The Human Element Remains King: Even with AI defensive predictions, split-second execution—like Damian Lillard pulling up from deep range with the shot clock winding down—proves that instincts and clutch mastery remain irreplaceable.
Discussion (0)
Continue Reading
More production-grade engineering deep dives and architectural guides

Biggest Hack in the World: Binance Suffers Unprecedented $6.3 Billion Multi-Chain Cyberattack
A comprehensive technical autopsy of the $6.3B Binance hot-wallet breach attributed to TraderTraitor (Lazarus Group). How automated sweeping, compromised DevOps credentials, and cross-chain execution sparked the largest heist in financial history.
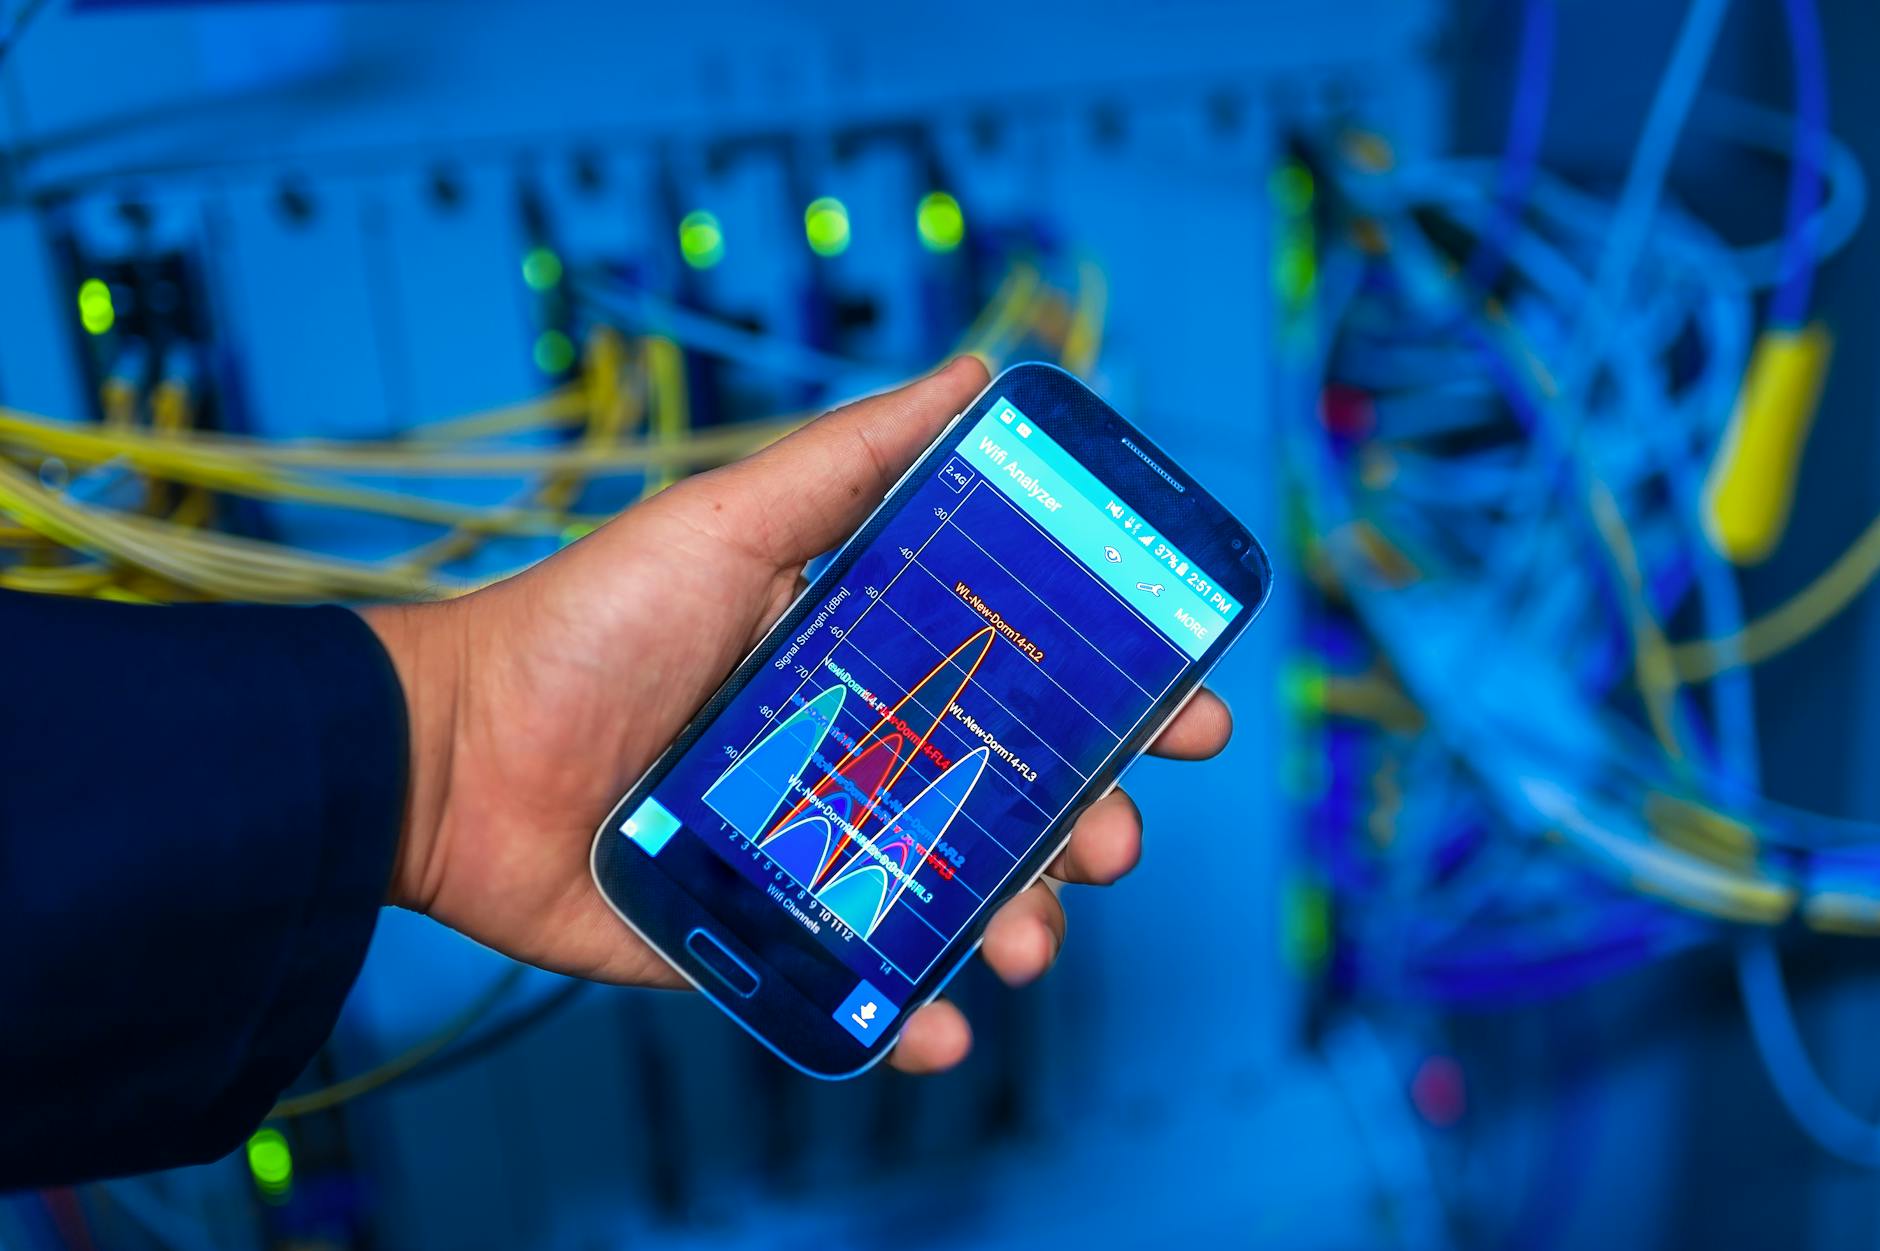
Mobile Push at 100M Devices: Benchmarking FCM, APNs, and Custom WebSockets
At 100M devices, push fails in the tail, not the median. We break down real delivery-latency percentiles for APNs, FCM, and owned WebSockets, plus a reproducible cost model and the reliability patterns behind 99.99%.
Landing Page Experimentation at 50M Sessions: Client-Side A/B Testing vs. Edge Decisioning vs. Server-Side Flags — Flicker, INP, and Cost per Million Decisions Benchmarked
At 50 million monthly sessions, where your A/B test makes its decision stops being a tooling preference and becomes a Core Web Vitals and P&L decision. This is a head-to-head benchmark of client-side DOM mutation, edge middleware bucketing, and server-side feature flags — measured on CLS flicker, INP, and true cost per million decisions.